by Josh Evans and Arielle Johnson
‘2% salt’. How many times has this phrase passed our lips? By the summer of 2013 we were realising that this simple edict, the core of many lacto-fermentation recipes, contained a crucial ambiguity. This post is an attempt to explore and clarify how different cultures—namely, those of the kitchen and the laboratory—measure things differently, and why it matters.
The problem
Many of the recipes and processes we talk about on this blog scale according to ratios. For example, for a typical lacto-fermentation, rather than starting with 1000 grams of vegetables and 20 grams of salt, it is simpler to weigh the vegetables you have and add 2% salt to them.
But what do we mean when we say “2% salt” or “25% sugar”? A chef might, when presented with 1000 grams of something to which they need to add 25% sugar, add 250 grams of sugar—since 250g is 25% of 1000g. On the other hand, to a scientist, a mixture of fruits with 25% sugar isn’t 1000g of fruits and 250g of sugar, but a mixture where 25% of the total weight is sugar: and if you started with 1000g of fruit, this total mixture will weigh 1333g and have 333g sugar in it, since 333/1333=25%. In fact, the mixture of 1000g of fruit plus 250g of sugar now only contains 20% sugar by composition, since the total weight is 1000g+250g=1250g, and 250/1250=20%. This difference could lead to problems if the 25% level of sugar was very necessary to reach!
And, unfortunately, while this gap is negligible for small percentage additions—taking “add 5% salt” to mean adding 50g of salt to 1000g of something will yield a mixture that is 4.76% salt by composition, which is pretty close—it gets bigger and bigger as the desired percentage increases, so the potential for error gets increasingly larger as the amount to add goes up: 10% vs. 9.1% is maybe not so big (maybe), but 35% vs. 25% definitely is pretty big.
Terms
As we mulled this problem over, different ways of representing this distinction emerged.
At the core of the issue is the relationship between the parts of a mixture and the whole. What varies is the relation’s direction—whether one is going from the former to the latter or vice versa.
1. ‘Process’ vs. ‘Product’
Our first framework for conceptualising this difference was ‘process’ vs. ‘product’: ‘process percentage’ for the easy-to-use number of what you actually need to add, in terms of the weight of what you are adding it to; and ‘product percentage’ for the percentage of what, by mass, is actually in the final mixture. These words capture the distinction neatly, but they may not be different enough to make an elegant notation with—to indicate which percentage we were using in our notes and results, which was the ultimate goal. So we kept brainstorming.
Figure 1. Word clouds of brainstormed terms for both methods of measurement
2. ‘Factor’ vs. ‘Ratio’
Another way to frame the distinction was one Justine sent over last March (you can see how long it’s been haunting us):
Justine: “I don’t know why it is just recently that I have been re-thinking about it, but I might have something to add to the conversation about percentages in food. I don’t know if it is still a issue in the lab, but anyways, I think you might be interested by my recent thoughts on it. I think it came because I had to explain my students about fermentation (always!). I suddenly remembered another scientific way to express a relative quantity. In science, when you have to do a 10% solution of something, you can either notate it with the % sign, or with the dilution factor 1:10. The factor means, for all scientists, that you have one part of something in a final volume of 10, so 1:10 is 1 part of something and 9 part of the other, always.
I guess you have to be careful in the lab and not confuse it with a ratio (like we did for some fermentation recipes, ex: 1:5:9).
Maybe you could add ‘ratio’ or ‘factor’ in front of each notation!”
Josh: “So if we were to write 1:10 for something, it’s sort of like the ‘scientific’ or ‘composition’ measurement of ‘factor’ would read like ‘1 in 10 parts x’, and the ‘chef’ or ‘production’ measurement of ‘ratio’ would read like ‘1 to 10 parts x’. Yet another way of illustrating the difference…”
Justine: “Factor is 1 of x and 9 of y for a total of 10xy; ratio is 1 of x and 10 of y for a total of 11xy. Maybe you can start a new way of writing and add some symbol to refer to what you are talking about, maybe an ‘f’ or a ‘r’ after the fraction, i.e. 1:10(f) for the former and 1:10(r) for the latter.”
3. ‘Production’ vs. ‘Composition’
The possibilities branched rapidly and recursively. We ultimately settled on using mainly percentage notation instead of ratios, but both modes could be used depending on one’s preference (and Justine’s ‘Factor/Ratio’ notation could work well for the latter). Since I (Josh) have been mainly using percentages, I settled for a while on ‘Production’ and ‘Composition’ as my terms, which I notated with %P and %C and which correspond, respectively, to Arielle’s and my original proposal of ‘process’ and ‘product’.
4. ‘Pluscent’ vs. ‘Percent’
I still wasn’t 100%C satisfied with this notation, because while it worked well enough (not brilliantly, but fine) in writing, it was clunky to say: “production percentage” is six syllables! It was only a few weeks ago, while finalising this draft, that the best solution so far emerged from the ether. Actually, it emerged from the keen mind of a friend named Dave Rowe, while he, his wife Pam and I were sharing a glass of wine and I was describing to them my on-going wrestling match with percentages.
Dave’s observation was that perhaps we should look at the word ‘percent’ itself as a starting point from which to generate an entirely new term to distinguish between the two methods. He quickly did so by suggesting the neologism ‘pluscent’ (a percentage that ‘is added’ to 100) as the logical counterpoint to ‘percent’ (a percentage out of 100). My follow-up question to Dave was how he would notate a ‘pluscentage’, to which he suggested that we create a new symbol—we collectively arrived at the idea of combining ‘+’ with ‘%’. On platforms such as our website that do not allow such custom fonts in-text, I have settled for using ‘+%’ in combination; otherwise, here is the glyph we designed (thanks to Rosemary, a former NFL intern and Artist-in-residence) and rendered as a font (thanks to Rosemary’s friend Daniel, a graphic and web designer).

Visualising the gap
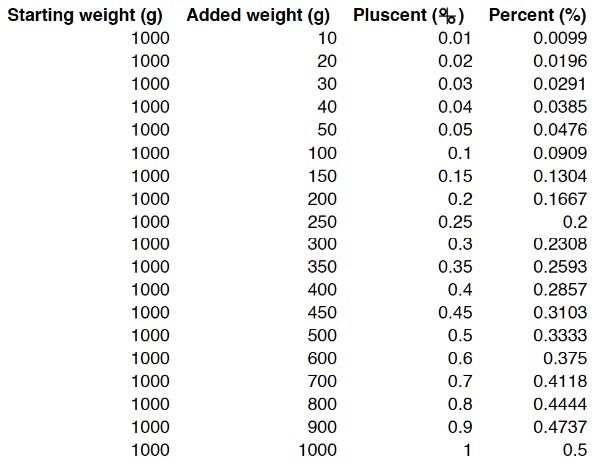
Table 1. Increasing gap between pluscentage and percentage for given weights.
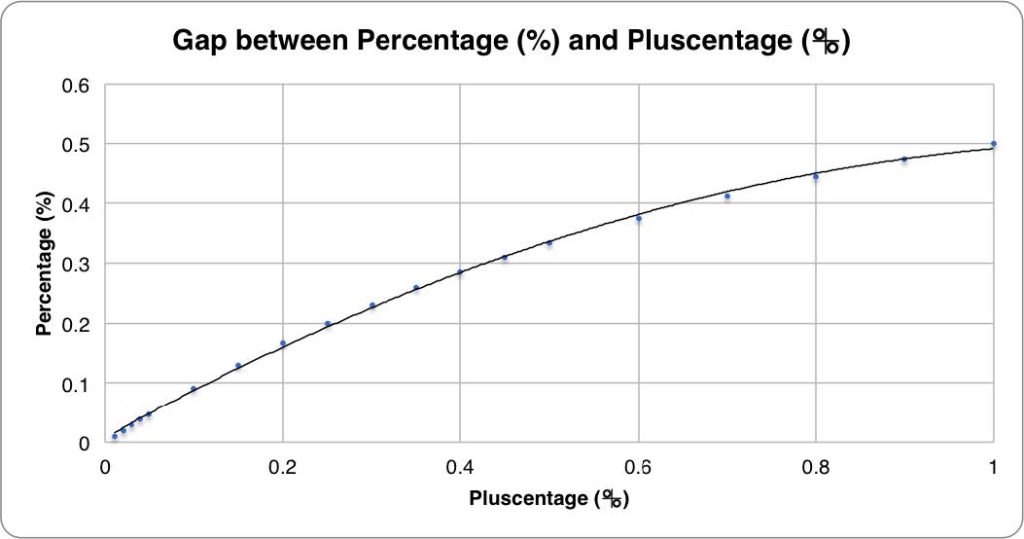
Figure 2. Gap between percentage (plotted on the y axis) and pluscentage (plotted on the x axis). The curve gets shallower, which shows how percentage drops off more as pluscentage increases.
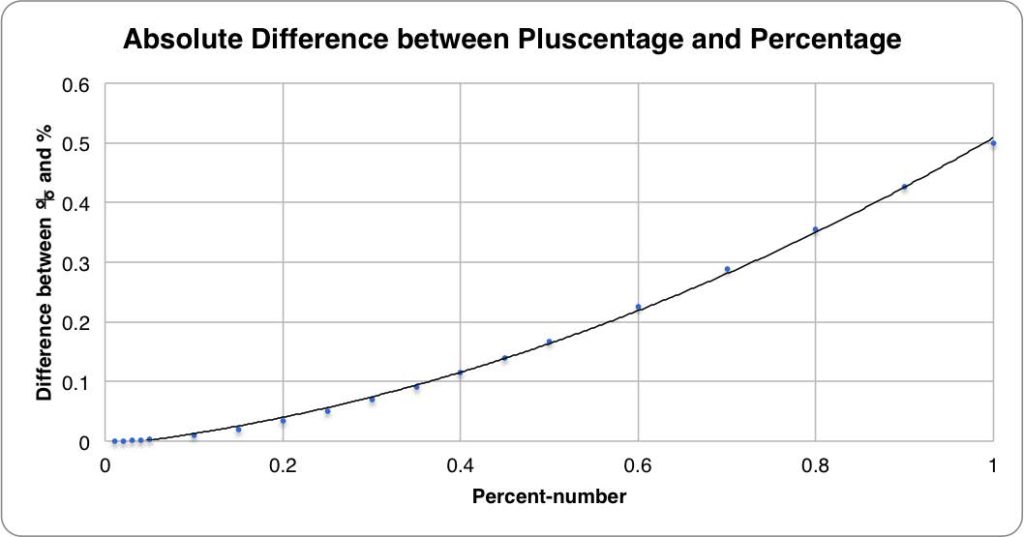
Figure 3. Absolute difference between percentage and pluscentage. The curve gets steeper—the difference between percentage and pluscentage gets bigger faster—as the percent-number increases.
Formulae and calculators
So, when it comes to making things, if one needs to reach a certain percent of an ingredient in the final mixture, one must bust out some algebra.
Given the weight of the mixture to be added to, it is necessary to solve for x:
x = az
and
a = 100b/(100-b)
where
x is the amount to add;
z is the amount to be added to;
a is the pluscent of the addition; and
b is the percent of the addition in the final mixture.
But fortunately, you don’t have to do that, because we made a calculator. Actually, three. The ‘Pluscent calculator’ can be used to calculate pluscent, given the desired percent of the addition in the final mixture; the ‘Addition calculator’ can be used to calculate addition amount, given the weight of the mixture to be added to and the desired percent of the addition in the final mixture; and the ‘Percent calculator’ can be used to calculate the percent of an addition in a final mixture, given the pluscent (the opposite of the first).
For example: You are making a garum. Let’s say you have 2730g mackerel guts and 600g barley koji, and you want to figure out how much salt to add to reach, say, 12% in the final mixture. You would use the ‘Addition calculator’, put ‘3330’ (2730+600) in the first field, ‘12’ in the second field, and obtain a figure of 454g.
If you wanted to figure out the pluscent for the salt, you would use the ‘Pluscent calculator’, insert ‘12’, and obtain 13.63.
And let’s say you were working from a garum recipe for which you already had the salt pluscent, and wanted to know the salt percent in the final mixture. You would use the ‘Percent calculator’, insert ’13.63’, and obtain 12.
Further considerations
Of course, this calculator only works if you’re dealing with 2 components—though one component can be composite, eg. the mixture of mackerel guts and koji in the example above. For multi-component ratios (salt : koji : legumes for a miso, for example) we’d have to make a more complex calculator, but it can be done.
The two measuring methods explored here are not the only ones out there. Baker’s percentages, for example, work differently—one ingredient, usually the most massive but also sometimes the most valuable, is set as a reference (100%), and the amount of every other ingredient is scaled as a percentage of the reference’s weight. Pluscentage can be thought of as the simplest baker’s percentage, where there are only two ‘ingredients’: the one to add and the one (or mixture of ingredients) to be added to. The advantage of baker’s percentages is that they can be used for more ingredients; the advantage of pluscentage might be that its relationship with percentage is more easily calculable, especially with recipes that change. For lots more on measuring methodology, check out Modernist Cuisine vol. 1.
Furthermore, of particular note for salt in fermentations is that it is not salt itself that matters, but how salt, and other compounds like sugar, hold onto water. What we are measuring here is water activity (Aw), and it is this measurement that in part determines whether or not certain microbes are able to grow. So really, the ideal situation would be to measure salinity in relation to water in a recipe (taking average moisture contents of constituent ingredients), but of course in practice this is somewhat difficult.
An experiment
While differences between these two (or more!) ways of measuring are clear in principle, and while I have started indicating which one I use in recipes, I still want to have some data that shows it matters when it comes to taste—and above what threshold. So I devised an experiment to address the role of this one variable in the complex phenomenon of fermentation.
Hypothesis:
A certain fermentation model system will exhibit gastronomically significant differences above some threshold if only salt concentration is varied by percent and pluscent.
Materials:
I made two different model fermentation systems—a low-salt miso and a high-salt miso—using Øland brown beans, pearled barley koji, filtered water, and sea salt (Table 2), in duplicate, each with three trials: one with salt by percent, one with salt by pluscent, and a negative control with no salt.
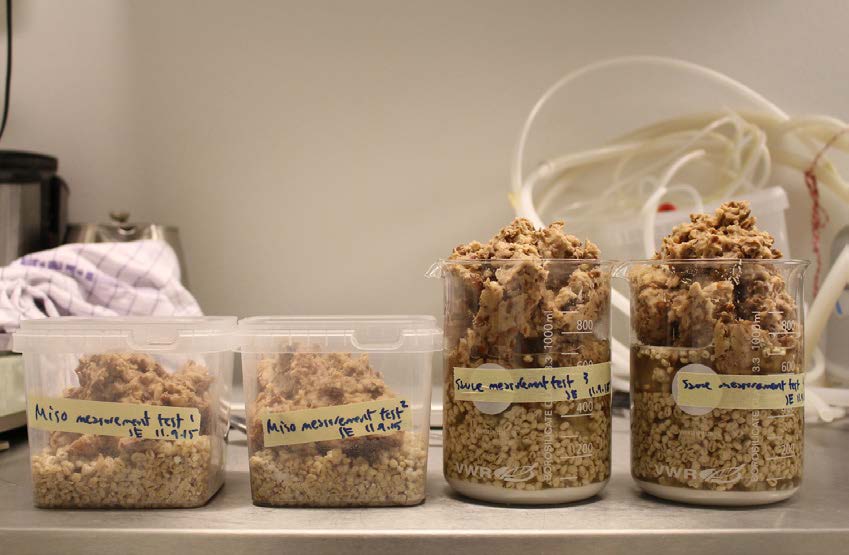
One set of duplicates before mixing; negative control not pictured.
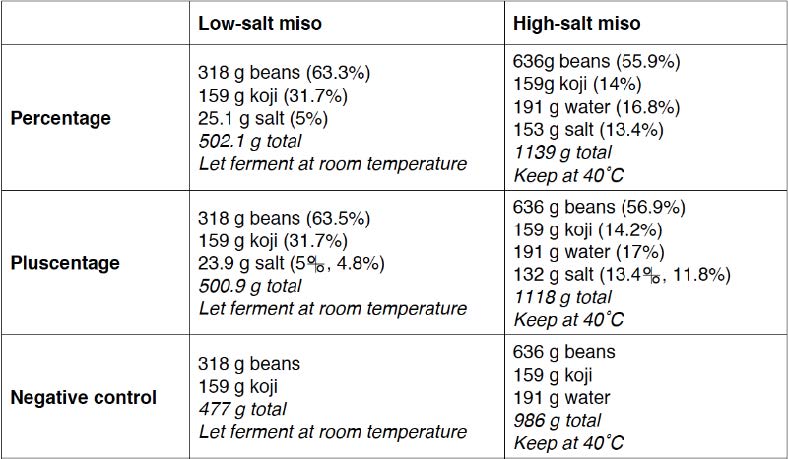
Table 2. Low- and high-salt miso trials varied by salt content: percent, pluscent, and none.
Methods:
I took samples of ~5ml at 2-week intervals over the 3-month fermentation, for a total of 7 samplings, which are frozen and await metagenomic sequencing by Martin Abel-Kistrup and Tom Gilbert, part of the Gilbert Group at the Centre for GeoGenetics at the Natural History Museum of Denmark, University of Copenhagen. We have already collaborated with Martin and Tom on doing some metagenomic sequencing of the microbial ecologies of some of our vinegar barrels; this should be an interesting next experiment.
I conducted a fast aroma and visual analysis after sampling for the seventh and final time and transferring the remainders of the final products to clean containers for cool storage.
Results:
See Table 3 for some notes from the informal aroma and visual analysis I conducted.
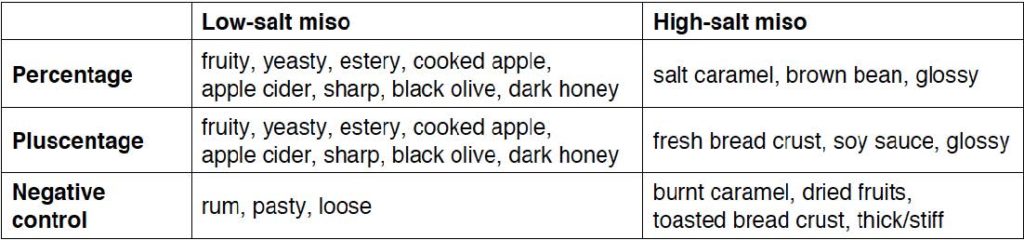
Table 3. Fast sensory analysis notes from the different samples.
Conclusions:
This is a very preliminary experiment, and it’s not yet done. It would be ideal to obtain more, and more rigourous, sensory analysis data (include tasting in addition to looking and smelling, gather sensory descriptors, serve samples blind, use ~10 panelists), and I’m dying to sequence the metagenomes of the samples to see if there are some differences in the microbial populations. Based on the preliminary results, I’d say it’s likely there are some differences happening in the microbial communities of the different samples.
Finally, I’m sure others have already thought about this measurement problem and come up with more elegant solutions for conceptualising, terming, and notating the different methods. It would be great to hear from you if you know of any existing materials.
In the meantime I’m finding ‘pluscent’ and ‘percent’ pretty useful.
If you would like to use the pluscent symbol yourself, you can download the font here. The pluscent symbol is the only glyph in the font, and is inserted with the ‘%’ key (shift+5 on English keyboards).
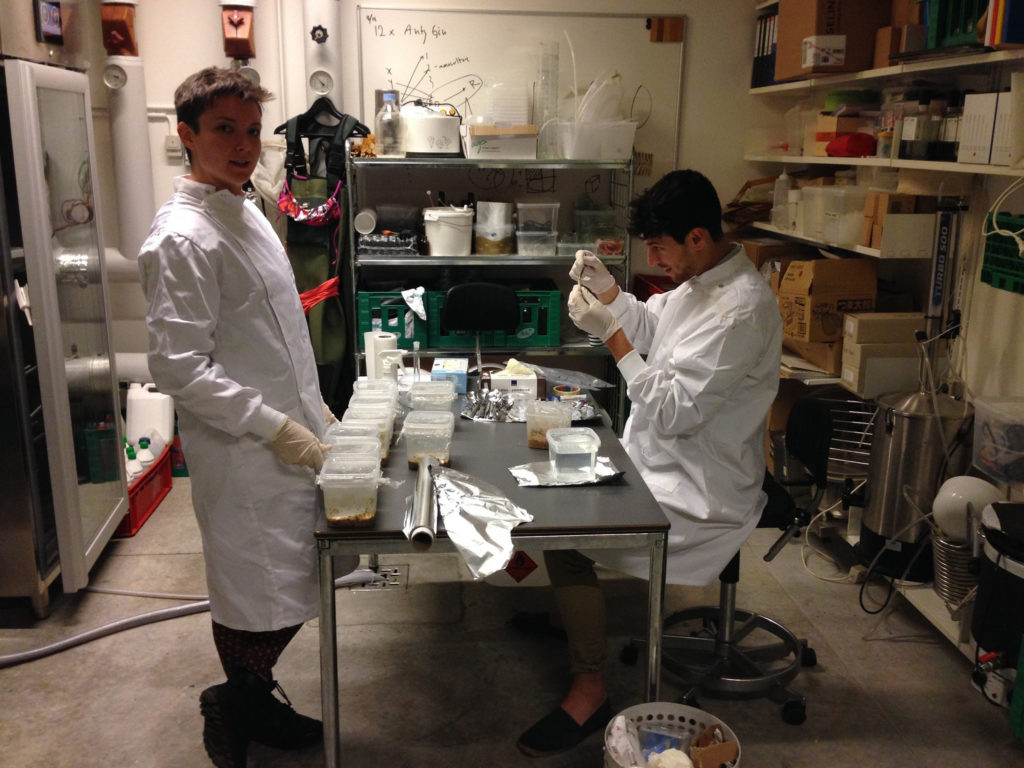
Anna and I taking our first samples.
Acknowledgements
We’d like to thank Justine, Guillemette, and other numbers-geekery-inclined team members past and present for contributing to this ongoing discussion; Dave Rowe and Pamela Camerra-Rowe for the stroke of brilliance that provided the world with ‘pluscent’ and the idea for its symbol; and Rosemary Liss and Daniel Givens for contributing their time and skills in creating the pluscent symbol in Illustrator and rendering it into a font with Fontello. Also many thanks to Anna Sigrithur for taking samples by herself multiple times while I was traveling in the fall.
References
Myhrvold, N. et al. Modernist Cuisine: The Art and Science of Cooking. USA: The Cooking Lab, 2011.